DCtoB and PowerlandMap announce a technology partnership

How the partnership works · powerlandmap.com · Follow on LinkedIn

News
Announcements and writing from the DCtoB team. What we are building, who we are building it with, and the thinking behind it.
How the partnership works · powerlandmap.com · Follow on LinkedIn
Why DCtoB has partnered with PowerlandMap, and what it changes for anyone who has to turn a site into a design.
Every concept design we produce rests on a handful of numbers that arrive before anyone can verify them. A target IT load. A grid position. A plot boundary. A density assumption. We can model what follows from them in hours. What we cannot do, from inside a design platform, is tell you whether those numbers were ever true.
That is the gap we have partnered with PowerlandMap to close.
Concept schemes rarely go wrong because a load was computed incorrectly. They go wrong because an assumption made in week one had quietly become a fact by week six, and nobody went back to mark it as provisional.
The three that cause the most damage are always the same. Gross electrical capacity gets presented as usable IT capacity, when the difference is the entire cooling and resilience strategy. A requested grid connection gets treated as a reserved one, and a reserved one as energised. And a plot is assumed to hold a target capacity because its area is large enough, when setbacks, access and the substation position decide the answer long before area does.
Each of those is an upstream question. By the time a design team sees the brief, the question has usually been answered by optimism.
PowerlandMap is a market intelligence platform covering data centre supply, power infrastructure, development opportunities and, importantly, the evidence behind capacity claims. It works upstream of design: screening where opportunities exist, separating announced projects from substantiated ones, and keeping the confidence level attached to every record.
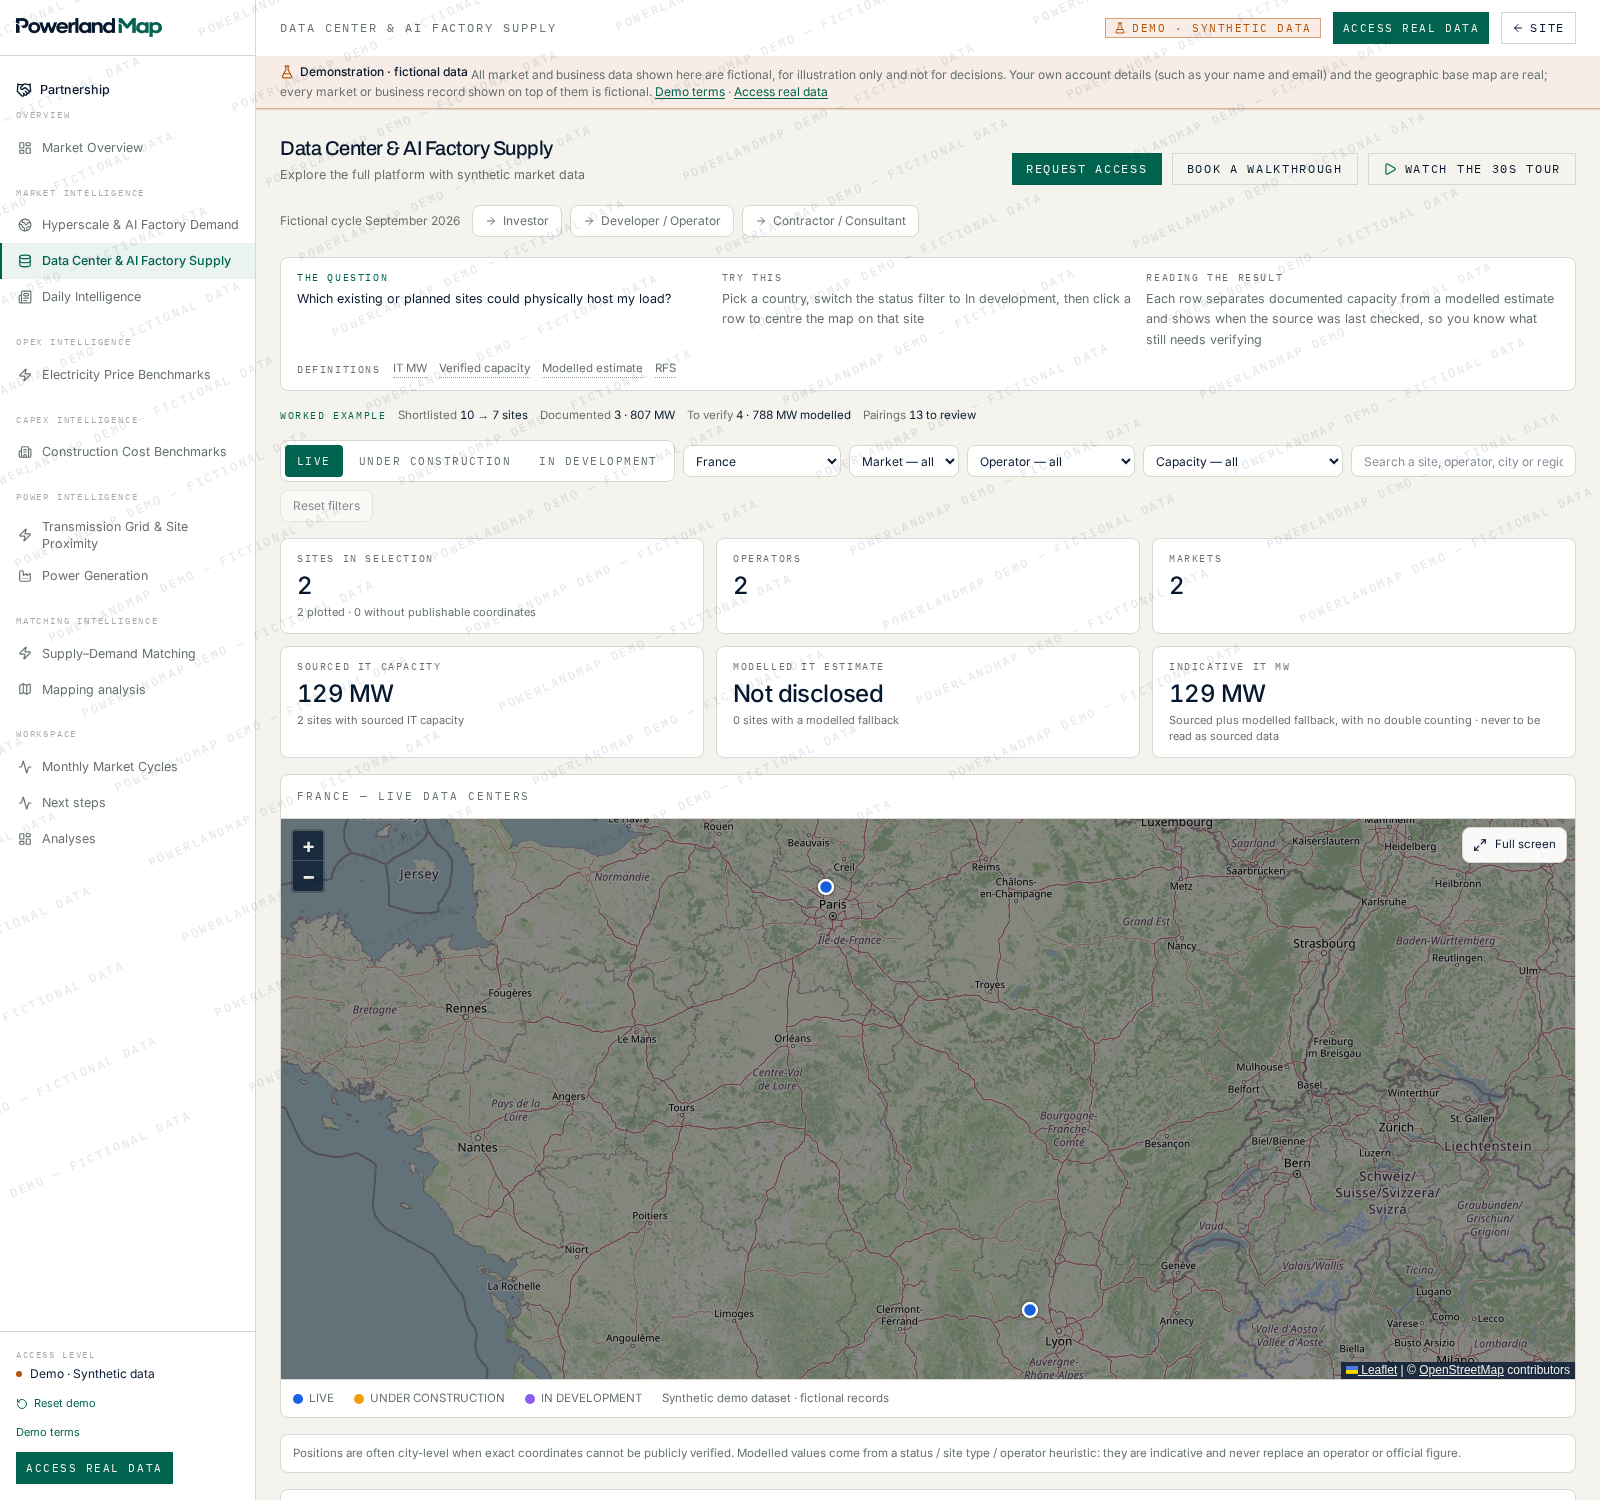
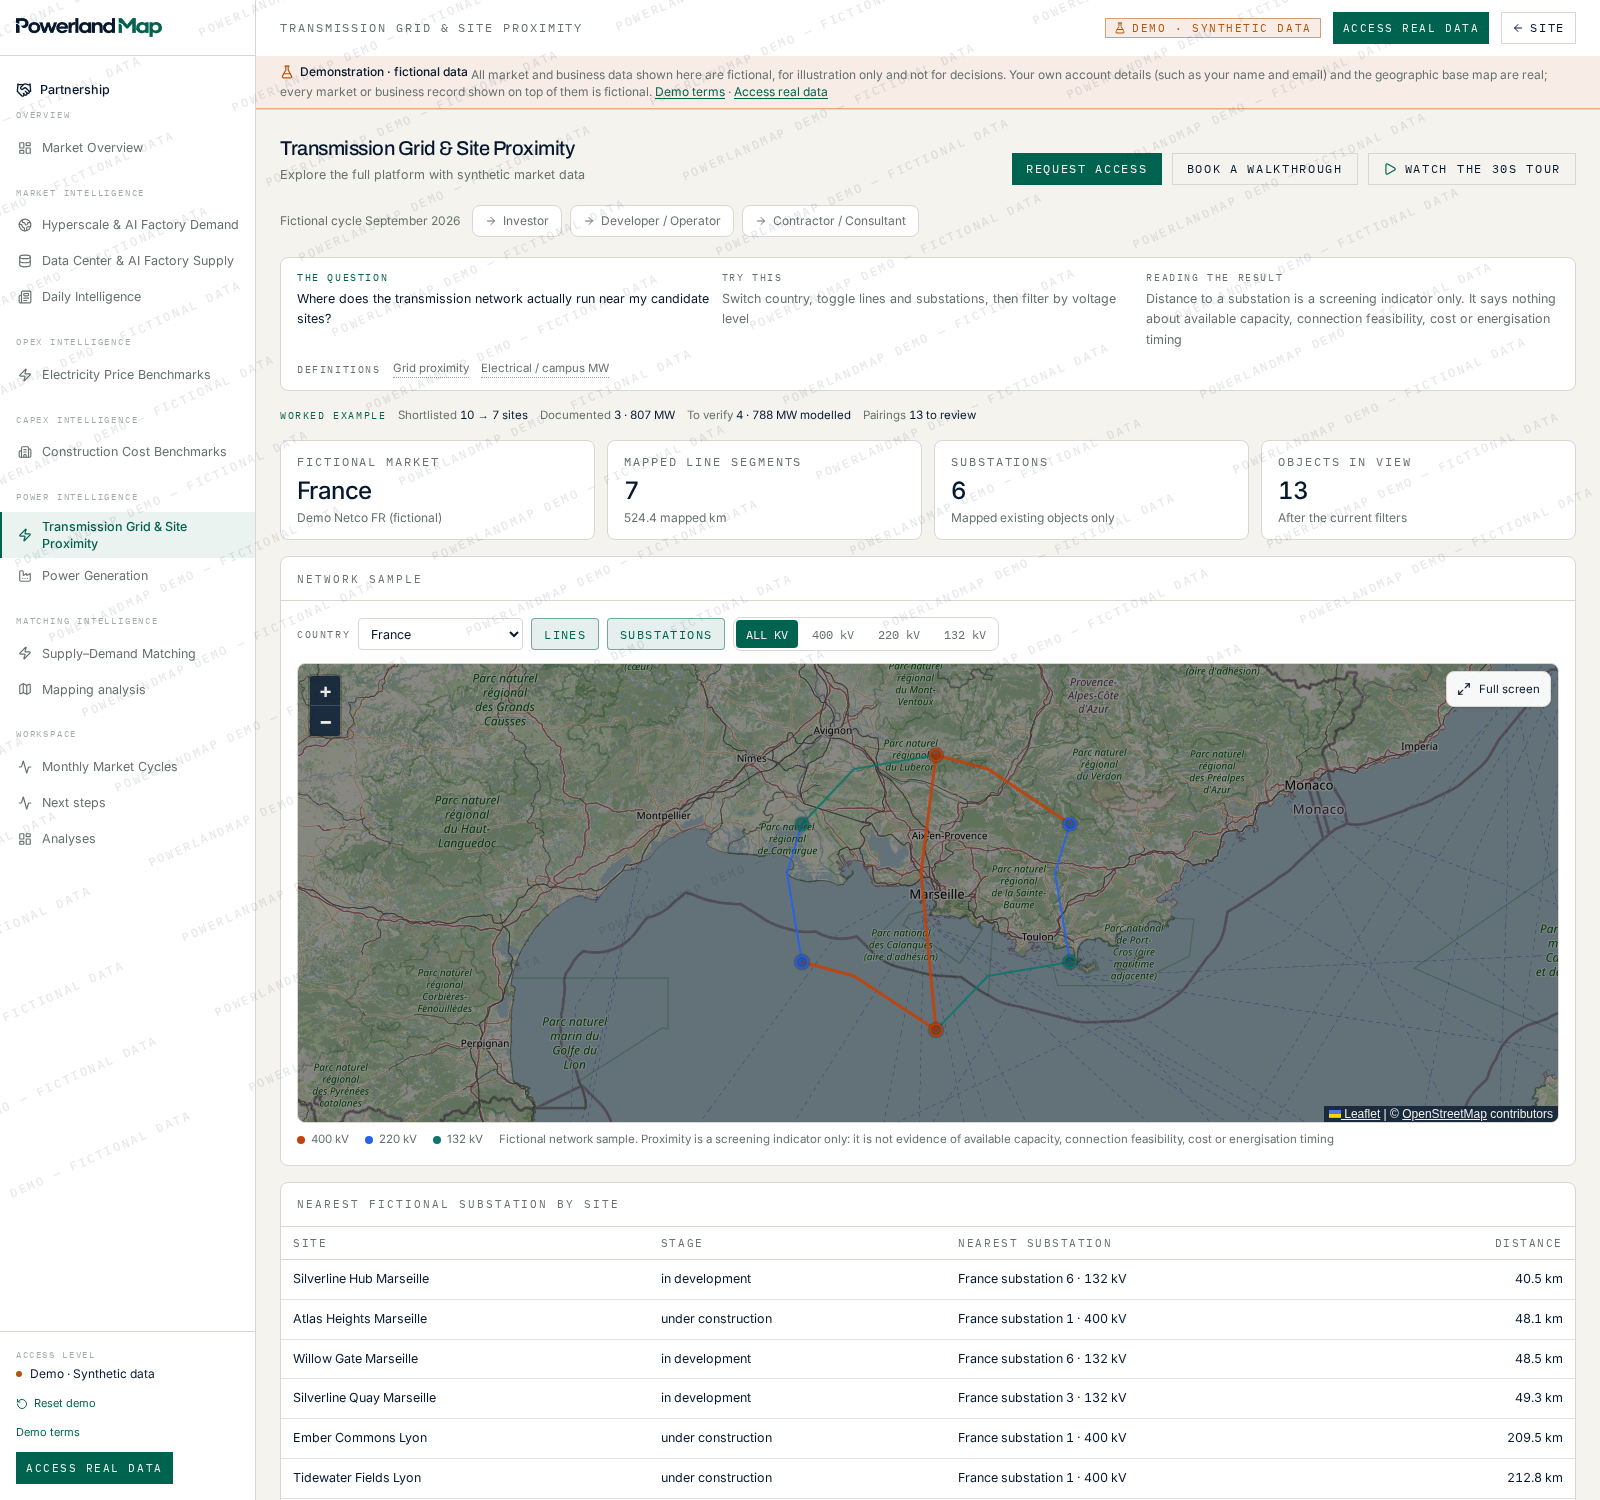
For us the most useful layer is the power one. Transmission lines, substations and documented connection milestones let a developer test proximity against process, and PowerlandMap keeps the distinctions we care about visible: requested capacity is not reserved capacity, and reserved capacity is not energised capacity. A brief that states which of the three applies is worth more to a design team than one that simply says how many megawatts.
Alongside it sits the commercial context — electricity price benchmarks across markets, and matching between qualified supply and anonymised demand. These are screening inputs rather than quotations, and they are the sort of input that changes which scheme is worth drawing at all.
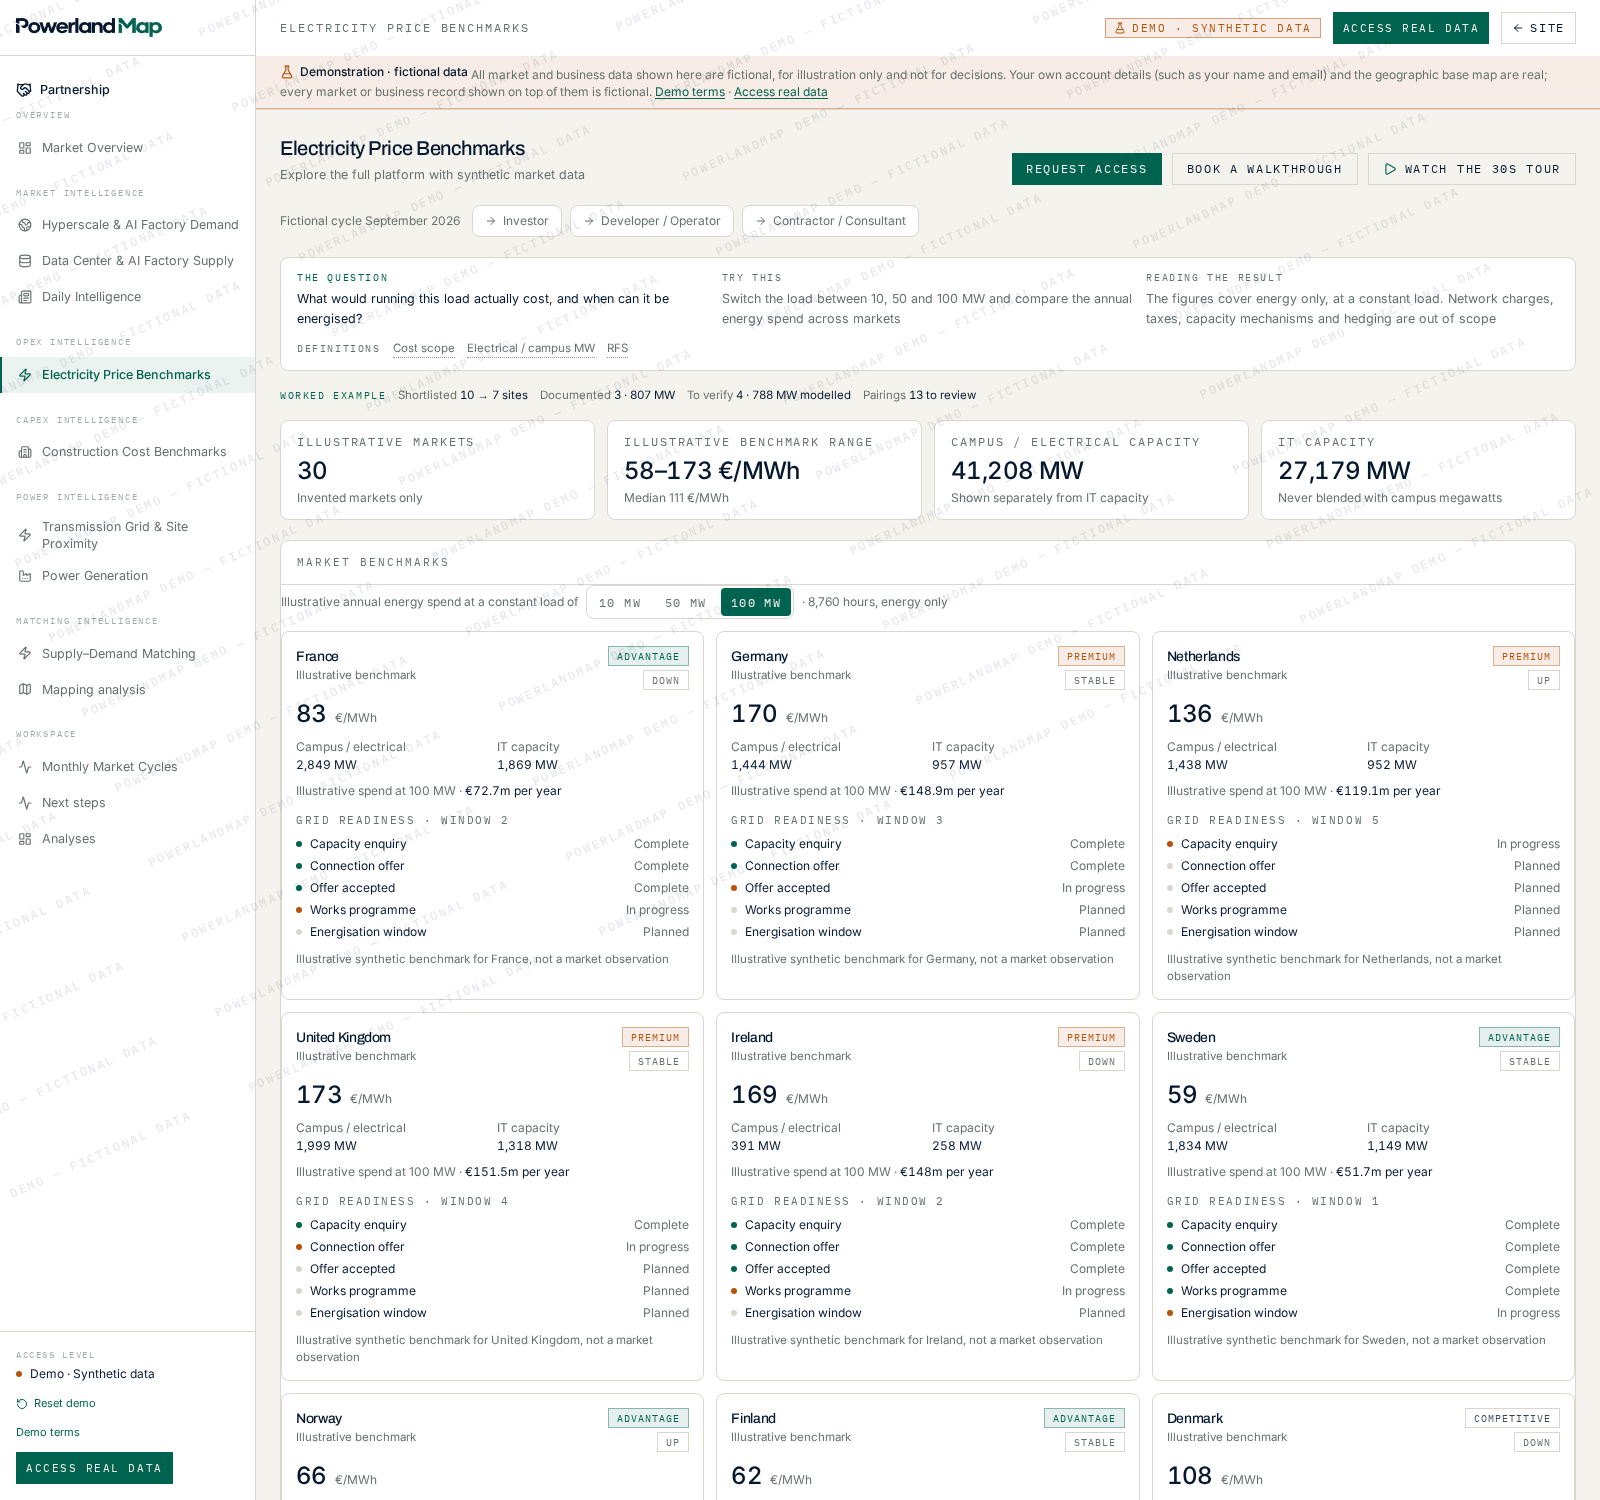
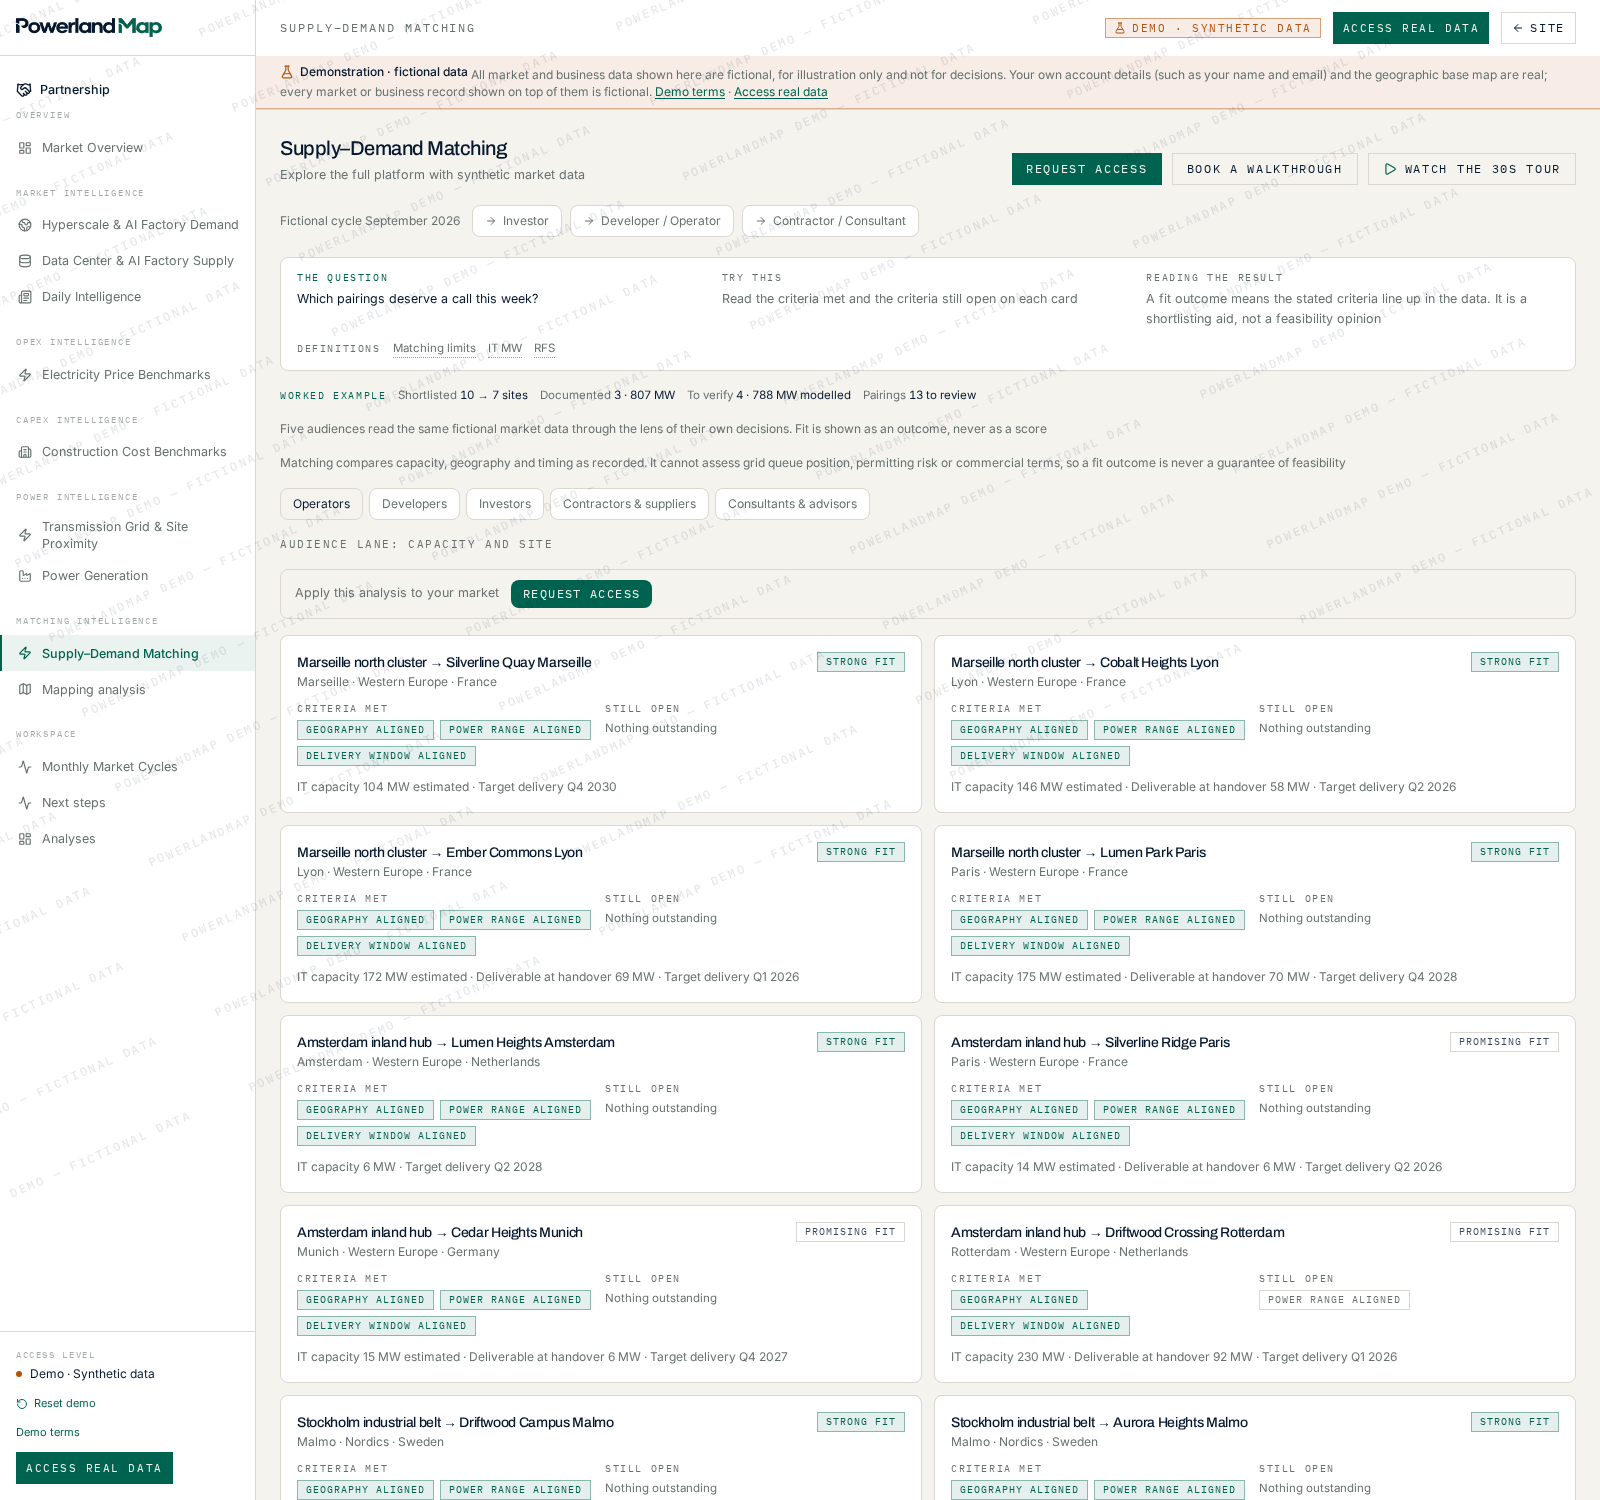
All four images illustrate the workflow. They are not actual opportunities, observed tariffs or confirmed connection feasibility.
DCtoB starts from IT load, not facility power, and derives everything else: heat load, cooling topology, electrical distribution, equipment selection, the resulting facility load and PUE. The facility figure is an output of the design, which is why we will not accept it as the input.
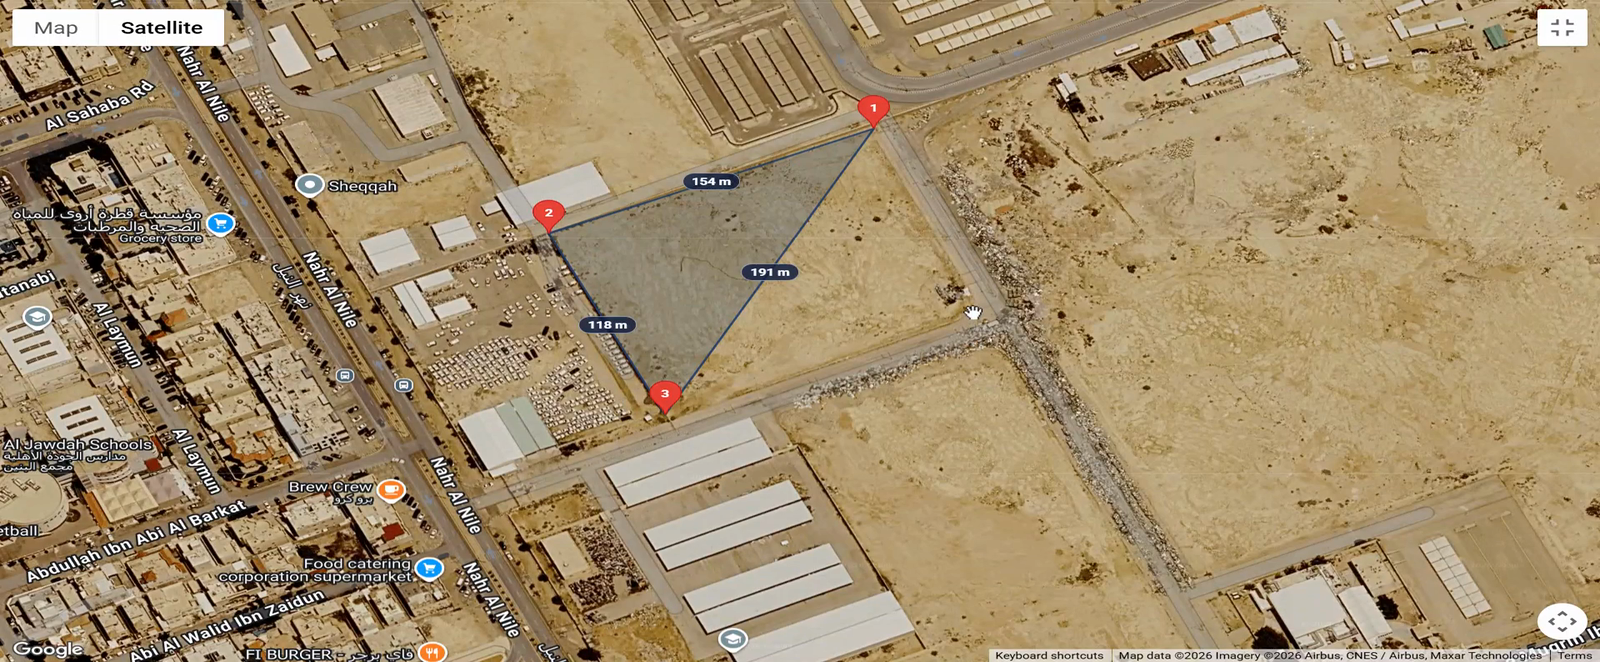
The plot comes next, and it comes as it actually is. The boundary is traced on the site with its real corner dimensions, access points and gates, and every layout that follows is constrained by it. Where a target capacity does not fit, the platform shows what does: a smaller first phase, a different arrangement, or a different plot.
From there the concept comes together in one model — electrical and mechanical single line diagrams, equipment sizing, 2D layouts and a 3D site model, and a preliminary bill of quantities that moves when the design moves.
.png)
This is the part we would most like clients to use. Redundancy is normally chosen as a label — N+1, 2N, a tier target — and almost never traced through the distribution that is supposed to deliver it. In DCtoB a user removes a UPS module, a generator or a feeder and watches where the load actually goes, across the electrical and mechanical paths through to the racks. A configuration that cannot carry the loss shows up at concept stage, not at commissioning.
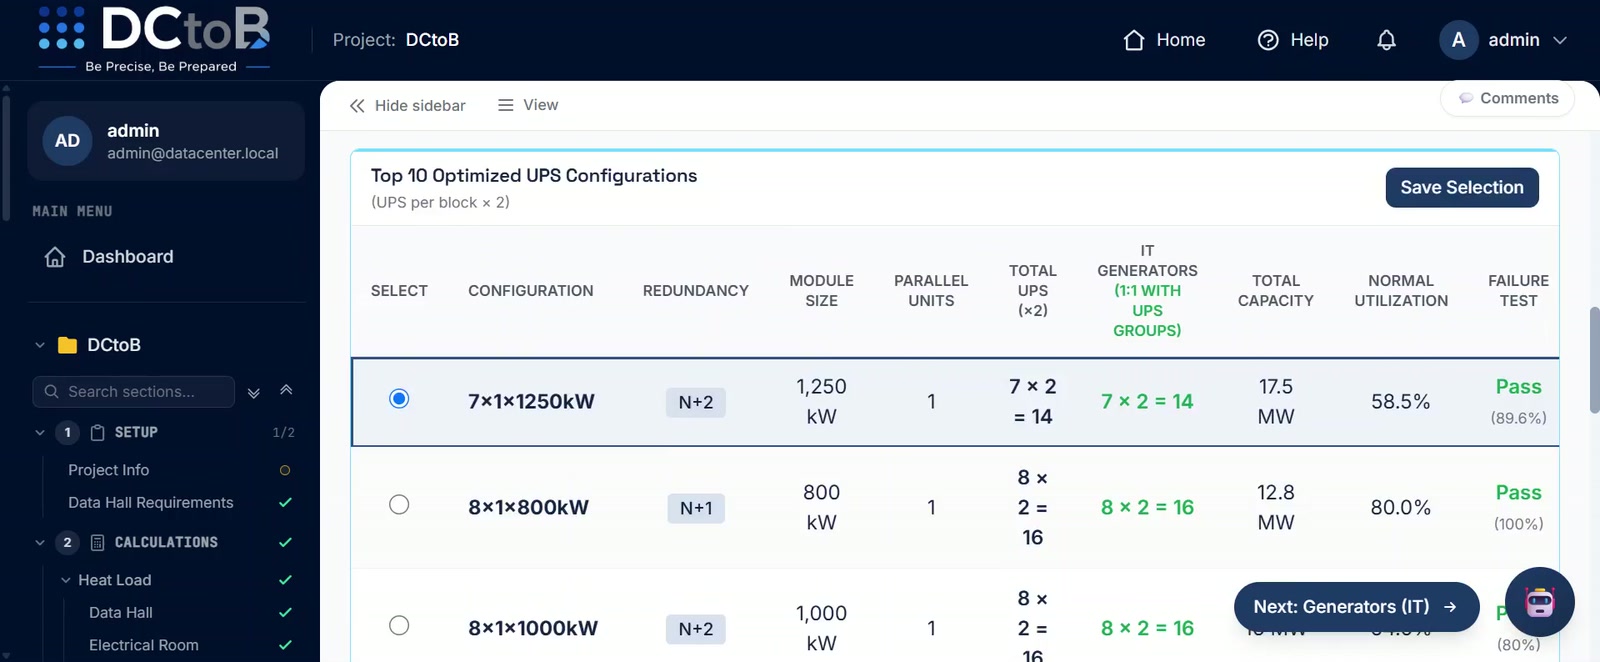
These tests are conceptual modelling of the design as configured. They are not an Uptime Institute certification, a commissioning result or a guarantee of operational availability, and they do not replace the resilience work carried out by qualified engineers at later stages.
PowerlandMap answers where the opportunity is and what evidence supports it. We answer what concept it implies and which assumptions should be challenged next. In between sits the part that actually matters: an agreed input package in which every unknown is recorded as an assumption rather than converted into a number.
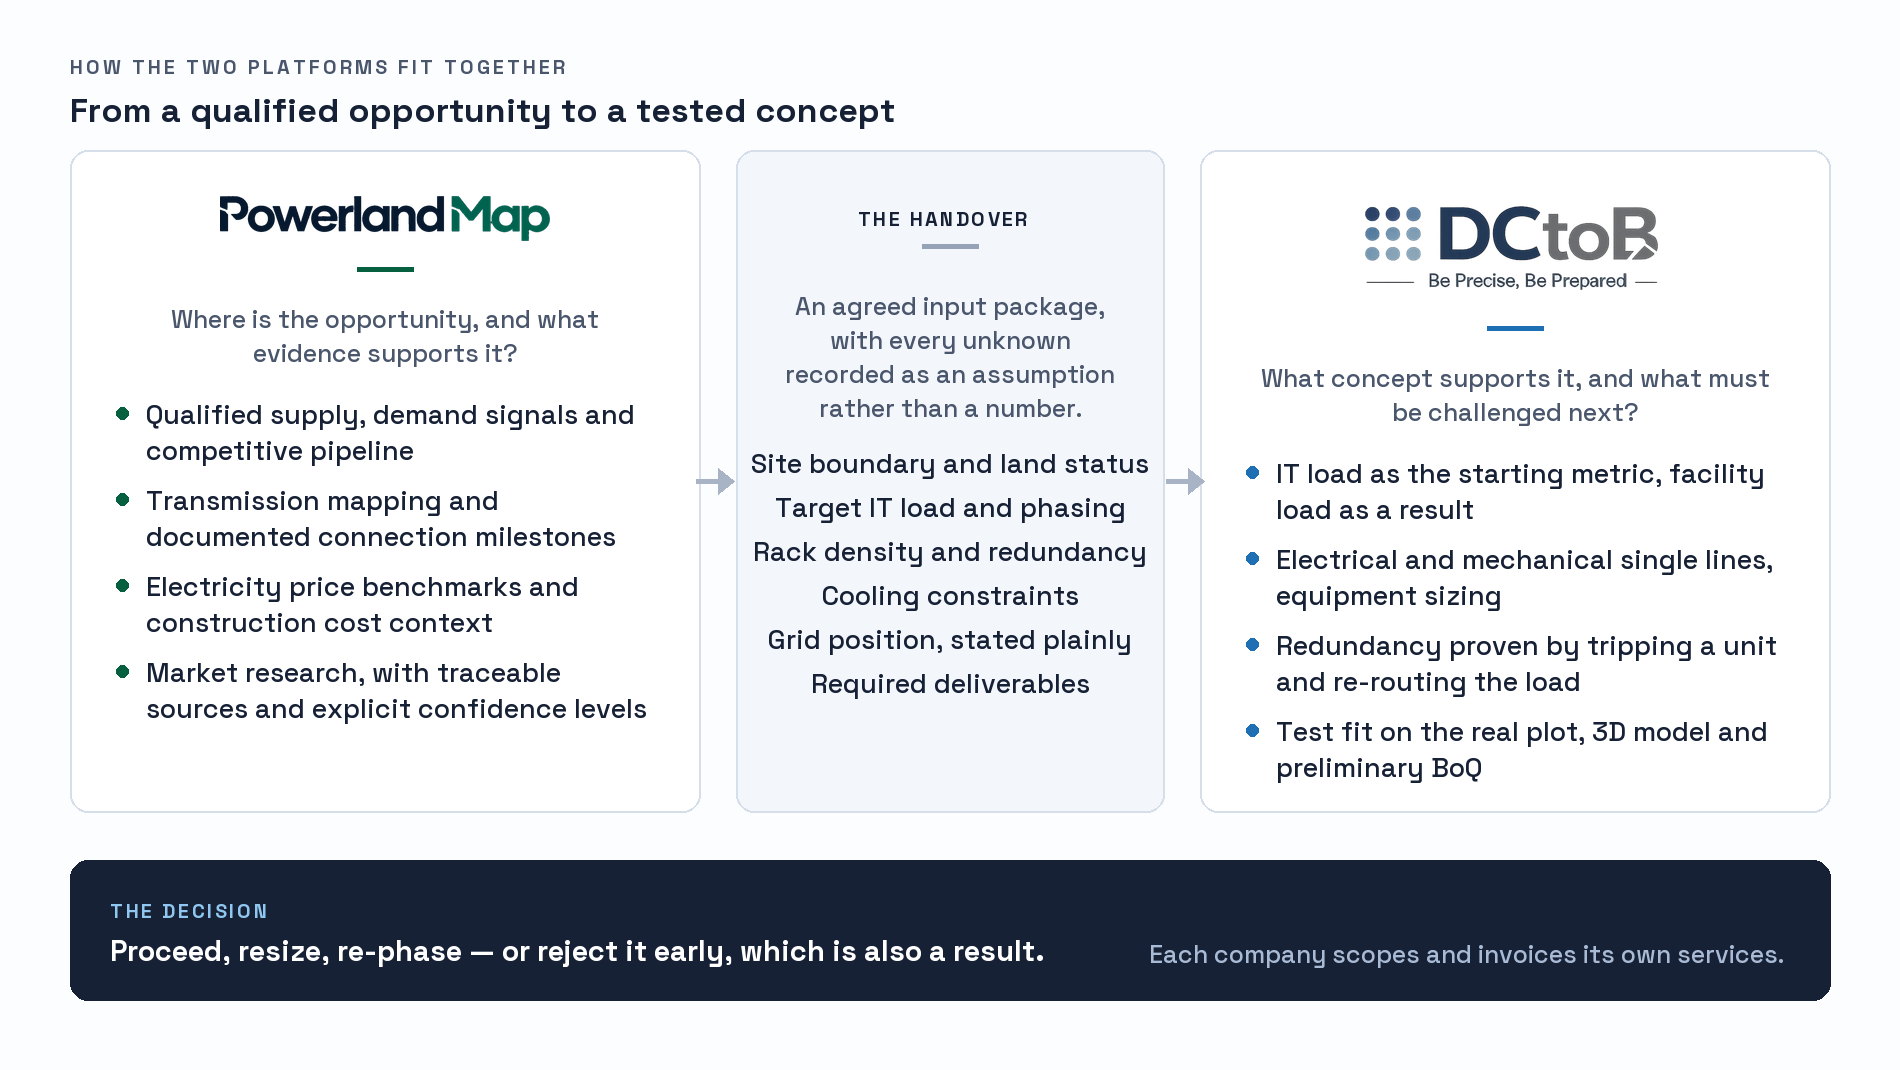
The platforms stay separate. There is no automated data transfer between them, and we would rather say so than imply an integration that does not exist. Each company scopes, contracts and invoices its own services, and the collaboration runs opportunity by opportunity rather than as an exclusive arrangement.
Developers testing whether a site holds what the pro forma assumed. Hyperscalers and end users who need to see a load, a density and a date fit together before committing. Consultants who want a defensible concept in days rather than weeks. EPC contractors who need quantities exact enough to price. And investors who would rather challenge an opportunity before paying for deeper diligence than after.
If you are qualifying a site, sizing a fit-out or pricing a build, we would rather show you than describe it. Request a demo, or read how the partnership works.
PowerlandMap, operated by The Platform Company, provides data centre market intelligence covering qualified supply, power infrastructure, anonymised demand signals, electricity economics, development opportunities and market research, using traceable sources and explicit confidence levels, with coverage and evidence depth varying by record and geography.
Request a demo to watch DCtoB take a data center from an IT-load target to a costed, standards-aware concept design.